I wanted to extract data from a simple image. My aim was to get the curve on the chart. Then I needed to scale so it works with temperatures. For that I needed to deconstruct numbers from image. I used cuneiform.
Here is what I end up doing.
import numpy as np
import pandas as pd
class Aladin():
def __init__(self, urlOfImg, color = (255, 0, 0, 255)):
from urllib import request
self.base_img_path = request.urlretrieve(urlOfImg)[0]
from PIL import Image
self.base_img = Image.open(self.base_img_path).convert('RGBA')
date = urlOfImg.split("/")[-1].split(".")[0]
self.start, self.end = self.deconstruct(date)
# cropping
temp_box_dim = (45, 204, 75, 356)
temp_img = self.base_img.crop(temp_box_dim)
self.temps_path = "/tmp/temps.png"
temp_img.save(self.temps_path)
chart_box_dim = (80, 215, 747, 348)
self.chart_img = self.base_img.crop(chart_box_dim)
self.color = color
def deconstruct(self, pr):
date = pr[:-2]
start_hour = str(int(pr[-2:]) + 2)
start = pd.Timestamp(start_hour + ":00:00 " + date)
end = start + pd.Timedelta(54, "h")
return(start, end)
def fit_to_temps(self, ser):
minT = min(self.temps)
maxT = max(self.temps)
import numpy as npser
ps = pd.to_datetime(np.linspace(self.start.value, self.end.value, len(ser)))
ser.index = pd.to_datetime(np.round(ps.astype(np.int64), -9).astype('datetime64[ns]'))
return (ser * (maxT - minT)) + minT
def get_pixels_by_color(self, img):
df = pd.Series()
for x in range(img.size[0]):
for y in range(img.size[1]):
pxs = img.getpixel((x,y))
if pxs == self.color:
df.loc[x] = -y
return (df + img.size[1]) / img.size[1]
def get_cunenumb(self, fn):
import subprocess
cune = ['cuneiform', '--singlecolumn', '-o', '/tmp/out.txt', fn]
res = subprocess.check_output(cune)
reader = ['cat', '/tmp/out.txt']
read = subprocess.check_output(reader)
return (read.rstrip().decode("utf8"))
def get_temps(self):
temps_str = self.get_cunenumb(self.temps_path)
self.temps = [int(i) for i in temps_str.split()]
def collection(self):
ser = self.get_pixels_by_color(self.chart_img)
self.get_temps()
self.data = self.fit_to_temps(ser)
def plot(self):
self.data.plot()
```python
now you can just call it by:
```language-python
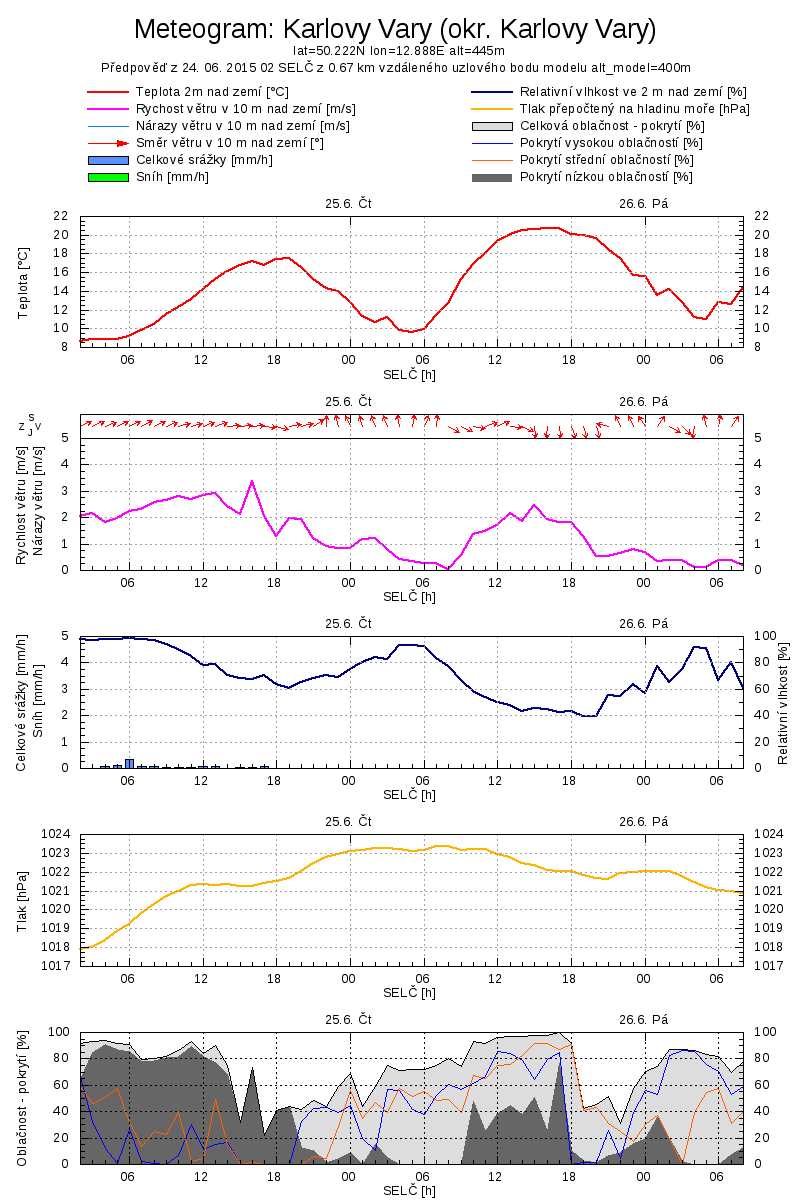
par = Aladin("http://www.danielhnyk.cz/media/blog/decoding-an-image/2015062800.png")
par.collection()
and then show data by par.data or par.plot().
This was the picture I tried to decode (it's first part).